1. The Moving Average Convergence Divergence (MACD)
The Moving Average Convergence Divergence (MACD) is a popular technical indicator used by traders to identify potential buy and sell signals in the financial markets. The popularity of the MACD indicator can be directly linked to its ability to calculate and indicate rapid short term momentum increase and decrease.
The Following Picture if Chart using MACD indicator With Buy signal and Sell signal.
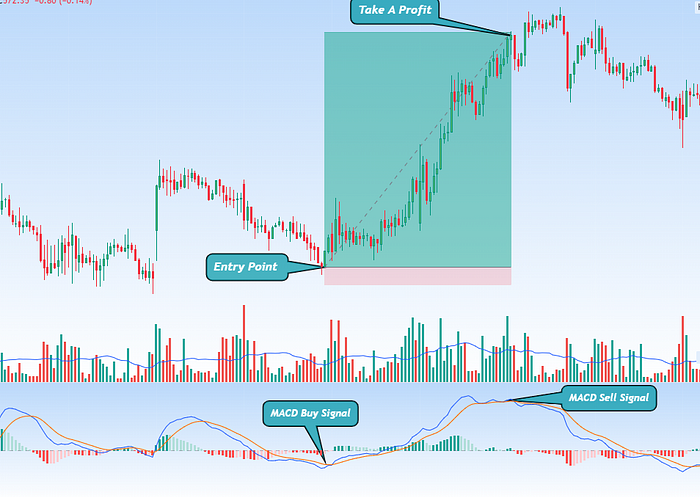
Buy Signal
When the Blue line crosses from below to above the Red, the indicator is considered bullish. The further below the zero line the stronger the signal
This indicates upward momentum and suggests a potential buying opportunity. Traders often interpret this crossover as a signal to enter a long position, expecting prices to rise. It’s important to consider other factors and confirmations for successful trading decisions.
Sell Signal
When the Blue line crosses from above to below the signal line, the indicator considered bearish. The further above the zero line the stronger the signal.
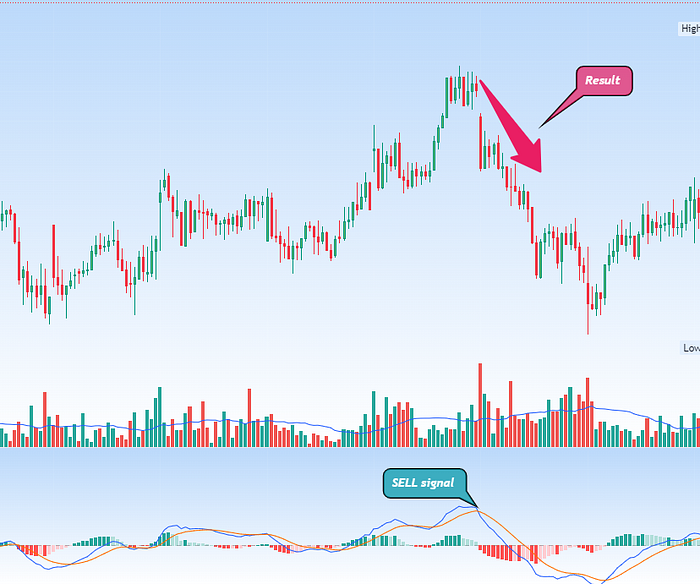
This crossover indicates a shift in momentum, suggesting a potential downtrend. Traders interpret this signal as a potential opportunity to sell or exit long positions in anticipation of further price declines.
2.Relative Strength Index
RSI, or Relative Strength Index, is a technical analysis indicator used in financial markets to assess the strength and momentum of price movements. It is primarily utilized to identify potential buy and sell signals in trading. RSI is displayed as an oscillator that ranges between 0 and 100, with higher values indicating overbought conditions and lower values indicating oversold conditions.
Overbought and Oversold Levels:
RSI values are usually interpreted with overbought and oversold levels. Traditionally, RSI values above 70 are considered overbought, suggesting that the asset’s price may have risen too far and a potential reversal could occur. RSI values below 30 are considered oversold, indicating that the asset’s price may have fallen too much and a potential upward reversal could happen.
Buy Signal
A common buy signal is generated when the RSI crosses above the oversold level (e.g., moves from below 30 to above 30). This suggests that the selling pressure has exhausted, and the asset might be poised for a potential price increase or a trend reversal. Traders might interpret this as an opportunity to buy.

Sell Signal
A common sell signal is generated when the RSI crosses below the overbought level (e.g., moves from above 70 to below 70). This indicates that the buying momentum has weakened, and the asset might be due for a potential price decrease or a trend reversal. Traders might interpret this as a signal to consider selling or exiting a long position.
3.Bollinger Bands
Bollinger Bands are a technical analysis tool used by traders and investors to analyze the volatility and potential price movements of a financial asset, such as stocks, currencies, or commodities. They consist of three lines
Middle Band (Simple Moving Average, SMA)
This is the central line of the Bollinger Bands and represents the average price of the asset over a specific period, usually a 20-day simple moving average.
Upper Band:
This band is located above the middle band and is typically set at a certain number of standard deviations (often two) away from the middle band. It reflects an upper price threshold based on recent price movements.
Lower Band
This band is located below the middle band and is also set at a certain number of standard deviations (often two) away from the middle band. It represents a lower price threshold.
Bollinger Bands are often used to identify periods of high or low volatility in a market. When the price of an asset moves close to the upper band, it suggests that the asset is overbought, potentially indicating a reversal or a decrease in price. Conversely, when the price moves near the lower band, it indicates that the asset is oversold, possibly signaling a price increase or a reversal.
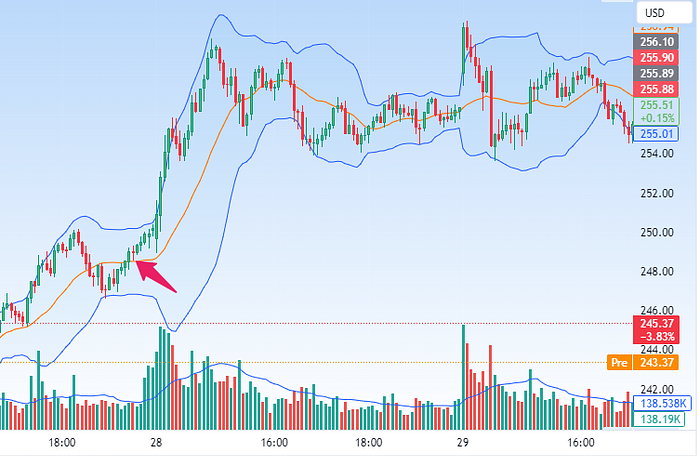
Buy Signal:
A buy signal in the context of Bollinger Bands is generated when the price of an asset crosses or touches the lower band and then starts to move upward. This can be interpreted as a potential opportunity to buy the asset, as the price may be poised to rebound from the oversold condition and move higher. Traders often look for confirmation from other indicators or patterns before making a buying decision.
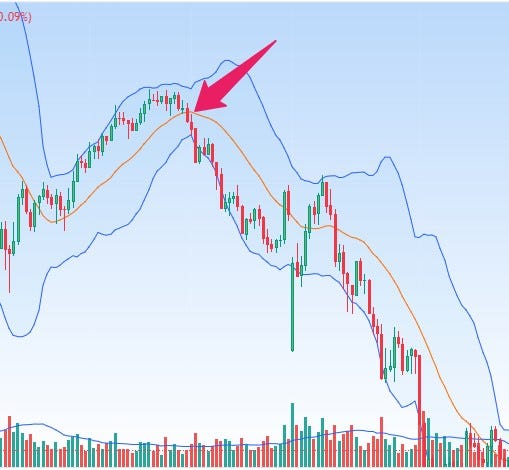
Sell Signal:
A sell signal occurs when the price of an asset crosses or touches the upper band and then starts to move downward. This suggests that the asset may be overbought and could potentially experience a price decline. A sell signal from Bollinger Bands is an indication to consider selling or taking profits, but traders typically use additional analysis to confirm the signal before making trading decisions.
4.Moving average
A moving average is a commonly used technical analysis tool in the field of finance and trading. It is a calculation that helps smooth out price data over a specific period of time, making it easier to identify trends and patterns in a financial instrument’s price movement. Moving averages are used to reduce short-term fluctuations in price and highlight the underlying trend.
There are several types of moving averages, including the Simple Moving Average (SMA) and the Exponential Moving Average (EMA).
Moving averages are often used to generate buy and sell signals in trading. These signals are based on the interaction between the moving average line and the actual price of the financial instrument. Here’s how buy and sell signals can be generated using moving averages:
Buy Signal:
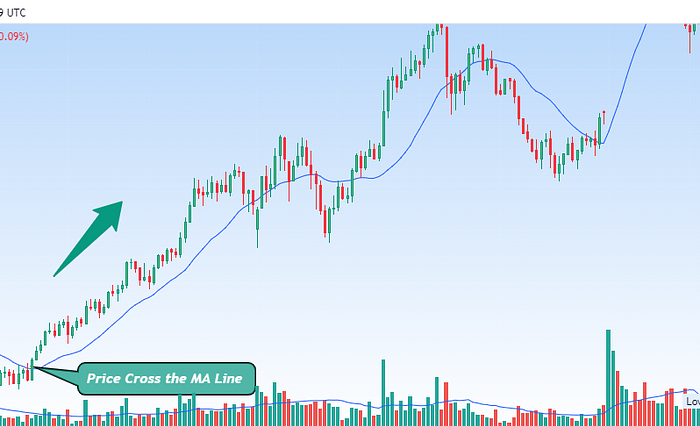
A buy signal is generated when the price of the financial instrument crosses above the moving average line. This can indicate a potential reversal or an upward trend in the price. Traders might interpret this as a signal to enter a long (buy) position.
Sell Signal:
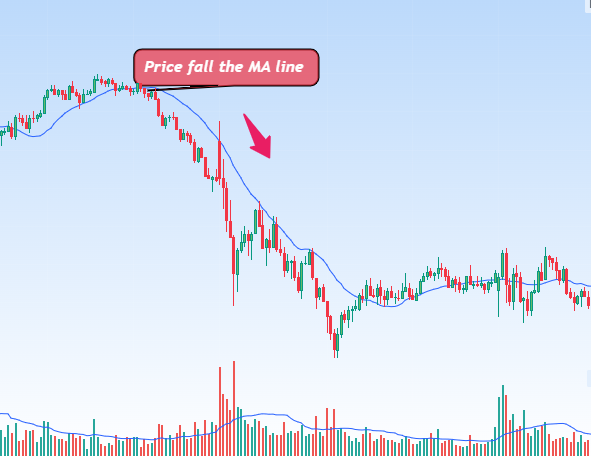
A sell signal is generated when the price of the financial instrument crosses below the moving average line. This can indicate a potential reversal or a downward trend in the price. Traders might interpret this as a signal to exit a long position or potentially enter a short (sell) position.
Comments