Support Levels
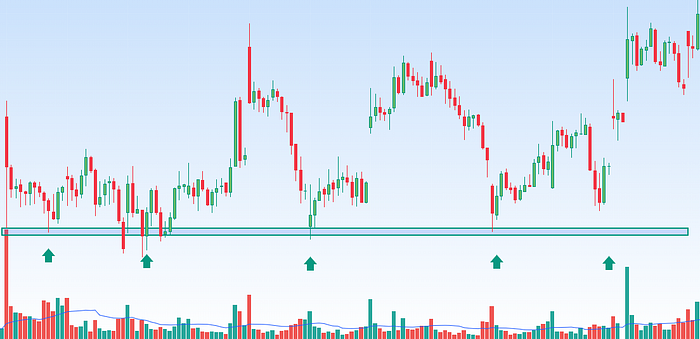
Support levels are typically identified on a price chart by observing previous lows or areas where the stock or index has repeatedly bounced back after declining. These levels can act as a psychological or technical barrier that attracts buyers who believe the stock is undervalued at that price.
As the Term suggests, it is the level at which the price of a security does not fall further as the demand is sufficient enough to hold the price from falling further.
Supports wills always appears or form below the current market price of security.
Support level or Zone ultimately gives us the reference point where the most repetitive buying (demand) has happened in the past and is likely to happen again in the market future .it is an important technical level from market participant’s point of view.
How to plot Support level
Identify significant lows Look for points on the chart where the stock price has previously bottomed out or reversed its downtrend. These lows represent potential support levels. Identify the most significant lows, preferably those that have been tested multiple times.
Identify significant lows: Look for points on the chart where the stock price has previously bottomed out or reversed its downtrend. These lows represent potential support levels. Identify the most significant lows, preferably those that have been tested multiple times.

Resistance Level
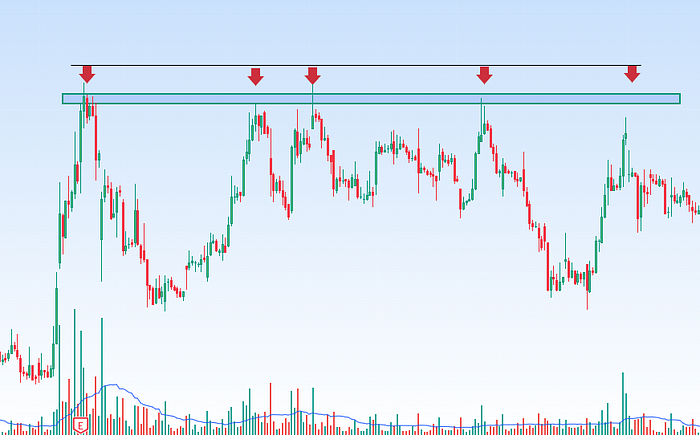
Resistance levels are typically identified on a price chart by observing previous highs or areas where the stock or index has faced selling pressure and reversed its upward trend. These levels can act as psychological or technical barriers that attract sellers who believe the stock is overvalued at that price. When the price approaches or reaches a resistance level, it is expected to encounter resistance and potentially reverse its upward momentum.
Resistance will appears or form above the current market price and of a security.
Resistance level or zone ultimately gives us the reference point where the most repetitive selling (supply) has happened in the past is likely to happen again in the future it is an important technical level from market participant’s point of view.
How to plot Resistance Zone
Identify significant highs Look for points on the chart where the stock price has previously peaked or faced selling pressure. These highs represent potential resistance levels. Identify the most significant highs, preferably those that have been tested multiple times.

Supports and resistance Reversal
Previous I explained Supports level, Resistance level and how to plot support zone and Resistance Zone.
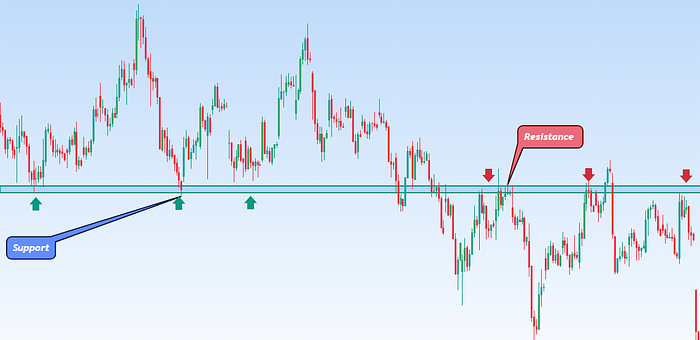
Support and resistance reversal refers to a technical analysis concept in which a stock or market Price breaks through a support or resistance level and experiences a significant change in its price direction. It suggests a potential shift in the supply-demand dynamics and can signal a change in trend
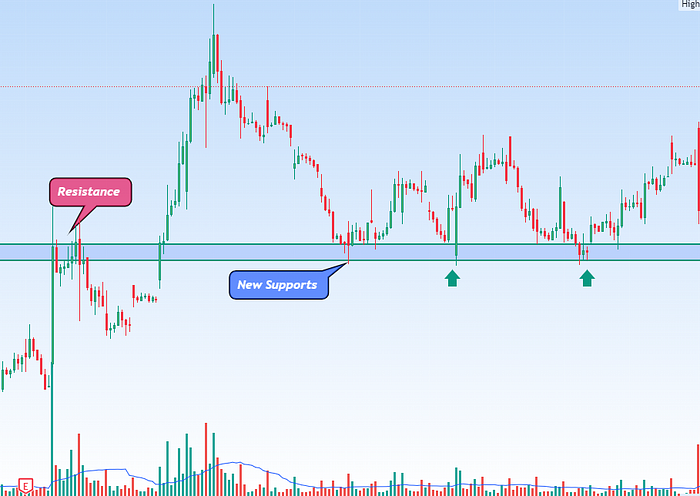
In the simple language a Broken Support level becomes a future resistance level and similarly a broken resistance level becomes a future supports level.
Supports Turned Resistance
A support reversal when a stock or market Price breaks below a support level that had previously prevented it from falling further. It can indicate a potential shift from a bullish to a bearish trend or a continuation of an existing bearish trend. Traders and investors may interpret a support reversal as a sell signal or an opportunity to short the stock.

Resistance Turned Supports
A resistance reversal when a stock or market price breaks above a resistance level that had previously acted as a barrier to further upward movement. This breakout of resistance suggests that buying pressure has intensified, and sellers are no longer dominant at that price. It can indicate a potential shift from a bearish to a bullish trend or a continuation of an existing bullish trend.

When support or resistance levels are reversed, they can become new levels of support or resistance, respectively. Confirmation of the reversal is sought through factors such as increased trading volume, strong price momentum, and the formation of bullish or bearish chart patterns.

Comments